

The basic Maple built in command to make plots is plot. We demonstrate its usage by examples.
|
|
|
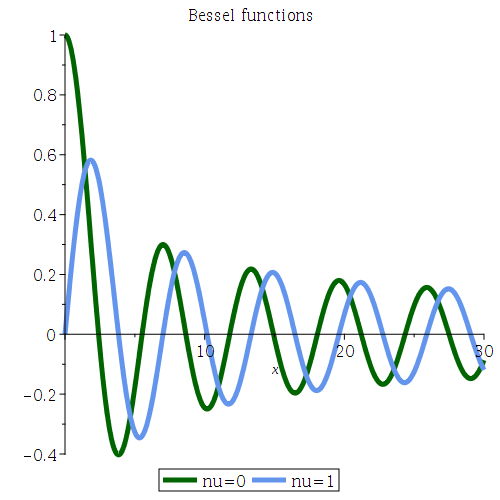
| Plot two Bessel functions. | Maple code |
|
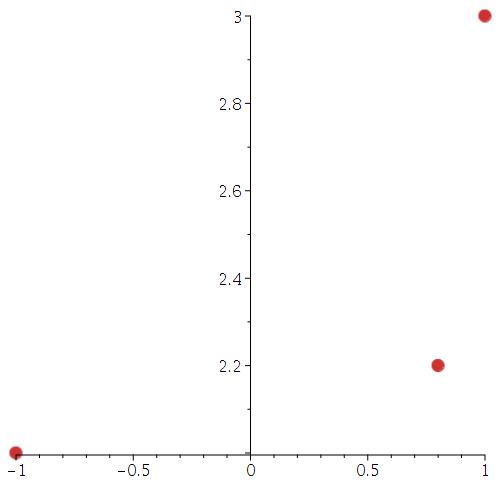
pointplot([[0.8,2.2], [-1,2], [1,3]], color=orange)
To change an individual symbol type and size, use the following procedure:
|
|
| Point plot. | Maple code |
\[ {\frac {ab}{c}}+13\,d \]
Example:
**DESCRIPTION OF PROBLEM GOES HERE**
This is a description for some Maple code. Maple is an extremely
useful tool for many different areas in engineering, applied
mathematics, computer science, biology, chemistry, and so much
more. It is quite amazing at handling matrices, but has lots of
competition with other programs such as Mathematica and Maple. Here is
a code snippet plotting two lines (y vs. x and z vs. x)
on the same graph:
(a*b)/c+13*d
ur code
another line
\[ {\frac {ab}{c}}+13\,d \]
Some Text