Linear EquationsBrown University, Applied Mathematics |
Linear Equations
Consider the initial value problem for the linear differential equation:
solve(IVP3)
Example: It is known from Genetics that gene expression is regulated by networks of mRNA transcription factors. In this problem, we model the rate of change of mRNA and check how it will affect overall gene expression. The change in mRNA concentration is denoted by \( \frac{{\text d}r}{{\text d} t} \) in each protein, where \( r \) is used to denote mRNA concentration. This rate is equivalent to the transcription \( f(p) \) (which is the production of more mRNA) minus the degradation (Vr):
Here we use the following notations:
\( t \) = time (in seconds)
\( r \) = mRNA concentrations (molecules per cell)
\( f(p) \) = Transcription functions (in molecules per second per cell)
\( V \) = degradations rates of mRNAs (is a constant in units of per second)
Transcription functions include activators and inhibitors. I want to use modeling to see
what is the effect on rate of change in mRNA with and without an inhibitor as a
transcription function.
Modeling inhibitors
The definition of an inhibitor in biology is a protein that binds to specific sequences and
effects the rate at which genes are transcribed. From this, I derive that transcription
functions f(p) is a function of the inhibitor:
where
h= inhibitor
a= activator
E(h)= effectiveness of inhibitor (in molecules per second per cell)
E(a)= effectiveness of activator (in molecules per second per cell)
If you want to have a simple formula for the effectiveness of an inhibitor \( E(h) , \) you have
reduced it down to be reliant on a few factors. The effectiveness of an inhibitor is
proportional to the amount of inhibitors present (n), the amount of complementary
substrate (m) that aids the inhibitor and the amount of active sites (o) for the inhibitor to
bind. The higher the sum of m,n, and o, the more effective E(h) is. I made simplified it
and made a linear equation that represents the effectiveness of the inhibitor.
\( c1, c2, c3 \) are constants (this depends each inhibitor and will be given in questions)
\( n,m,o \) are initial conditions of the environment
\( n \) = amount of inhibitors present (molecules/second/cell)
\( m \) = the amount of complementary substrate (molecules/second/cell)
\( o \) = the amount of active sites (molecules/second/cell)
From modeling gene expression, we can find solutions to the following problems:
(a) Set values of n,m,o and find E(h), the effectiveness of an inhibitor with c1, c2, c3
values of 2, 5 and 1 and predict how this will affect the rate of change in mRNA.
(b) Plot E(h) for values of n,m or o in certain ranges (according to the way I modeled
the equation, n,m and o will have same graphs but we can switch this equation up
by adding powers to n,m,o, etc)
(c) For certain values of n,m,o, what is E(h)max, E(h)min?
(d) If given enough values, we can solve the differential equation for r= mRNA
concentrations or other values.
References:
1. Nature review: Molecular Cell Biology:
http://www.nature.com/nrm/journal/v9/n10/fig_tab/nrm2503_F2.html
2. Dynamic System for Gene expression:
http://arep.med.harvard.edu/pdf/Chen99.pdf
3. Enzyme Inhibition and Toxicity: https://ocw.mit.edu/courses/chemicalengineering/
10-492-2-integrated-chemical-engineering-topics-i-introduction-tobiocatalysis-
fall-2004/lecture-notes/lecture4.pdf
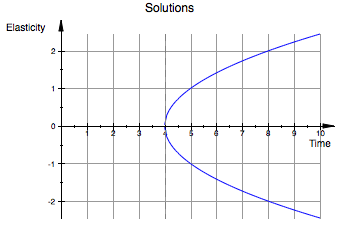
Labels are used as parameters inside the plot function. The syntax is as follows: 'Header = ['This Is My Title']' and 'AxesTitles = ['Xaxis Title', 'YAxis Title']'. Here is an example with all the aspects at once:
curve2 := (-sqrt(x -4))
plot(curve1,curve2, x=0..10, y=-5..5, Header = 'Solutions', AxesTitles = ['Time','Elasticity'],GridVisible = TRUE)
Home |
< Previous |
Next > |