 |
 |
|
|
|
|
|
|
|
|
|
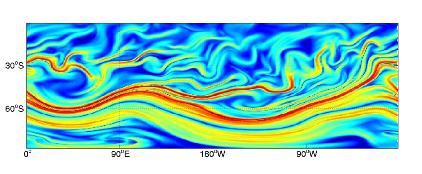
Note the local minima (blue) of relative dispersion at the core of the
jet and in the vortex core (the bottom edge of the images). The filaments
of local maxima (red) are highly suggestive of the chaotic advection mechanism.
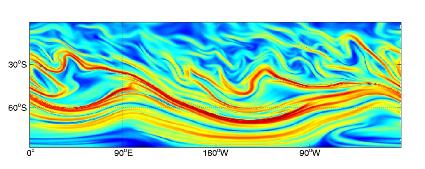
This can be appreciated more by plotting the two calculations together:
(click on this frame and hit the reload button to
re-animate)
Forward time maxima are color-coded blue and backward time maxima are magenta.
Relative dispersion identifies material curves to reveal a geometry that agrees well with the chaotic advection paradigm. The intersections of these curves near the crests in the jet meanders correspond to the hyperbolic fixed points generating the manifolds in the standard theory, whereas other intersections define lobes. The evolution of the lobes in time may be tracked to study the nature of transport in the surf zone. The lack of a curve of local maxima that crosses the jet suggests that little transport occurs across the jet via the chaotic advection mechanism.